|
||
|
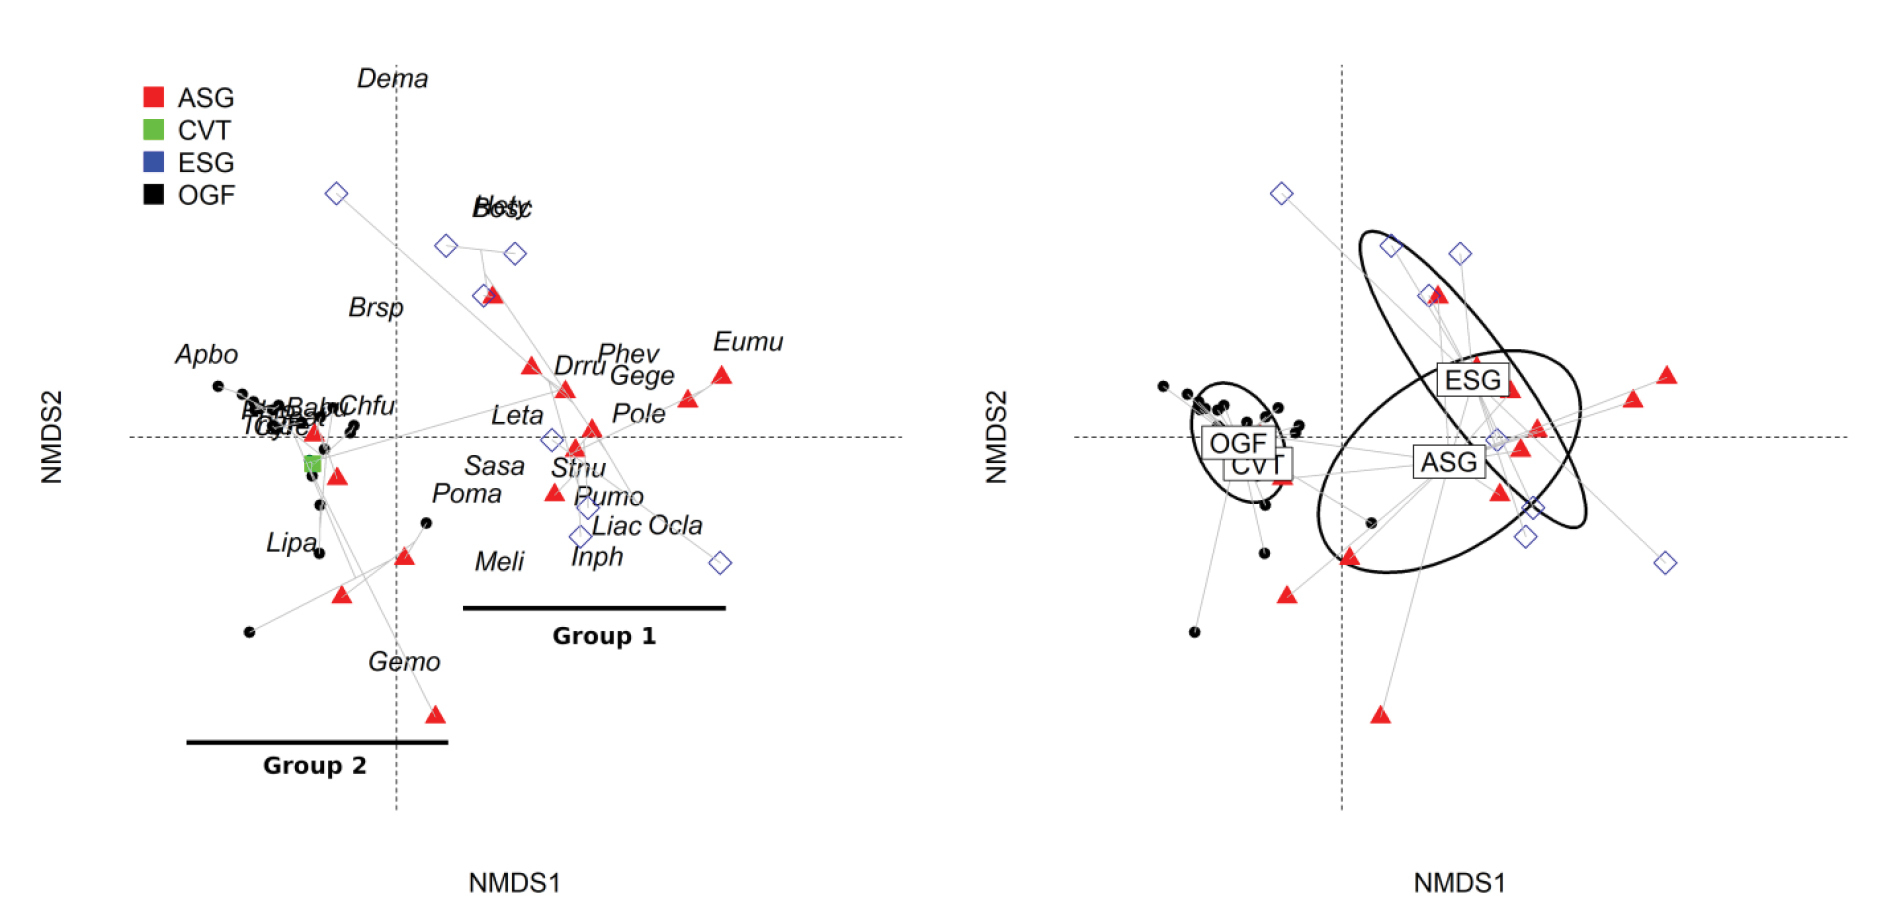
Non-metric Multidimensional Scaling plot of sites and species. Left – showing the position of species (coded as follows: Babu = B. busuangensis, Chfu = C. fusca, Poma = P. moellendorffi, Inph = I. philippinicus, Leta = L. tagbanorum, Liac = L. acanthi, Lipa = L. palavanensis, Meli = M. ligayae, Ocla = O. laevis, Phev = P. everetti, Phlo = P. longicrus, Pole = P. leucomystax, Poma = P. macrotis, Sasa = S. sanguinea, Stnu = S. nubilus, Brsp = B. cristatella, Cyre = C. redimiculus, Geat = G. athymus, Gege = G. gecko, Gemo = G. monarchus, Eumu = E. multifasciata, Hety = H. typus, Apbo = A. boa, Bosc = B. schultzei, Dema = D. marenae, Drru = D. rubescens, Trsu = T. subannulatus) and sites (point shapes) along the NDMS axes. The grey line represents the overlaid branches of dendrogram from cluster analysis and groups are indicated by solid lines. Right – A bivariate plot depicting the standard deviation of sites scores per habitat type, represented by ellipses; grey lines indicate sites connected and associated with a particular habitat type. |